Business Intelligence (BI) has become the foundation of digital decision-making in 2026. With organizations generating petabytes of structured and unstructured data, dashboards alone are no longer enough. Companies demand real-time insights, predictive modeling, and AI-powered decision support. As a result, BI tools have evolved from static reporting systems into intelligent platforms driving strategy, compliance, and growth.
Among the most dominant players in the market are Microsoft Power BI, Tableau, and Google Looker. Each tool reflects a unique philosophy: Power BI focuses on democratizing analytics, Tableau excels in storytelling and visual clarity, and Looker redefines governance with cloud-native scalability. This article provides a comprehensive comparison of these tools, their strengths, weaknesses, and the industries that rely on them most.
Data analysts and engineers comparing platforms for technical and operational fit.
Product managers and SaaS founders exploring embedded analytics.
Compliance and finance officers seeking secure, auditable BI solutions.
- Power BI democratizes analytics, integrates seamlessly with Microsoft, and is highly cost-effective.
- Tableau excels at storytelling, persuasive dashboards, and customer-centric insights.
- Looker ensures governance and is ideal for cloud-native, API-first organizations.
Power BI: Analytics for the Microsoft Ecosystem
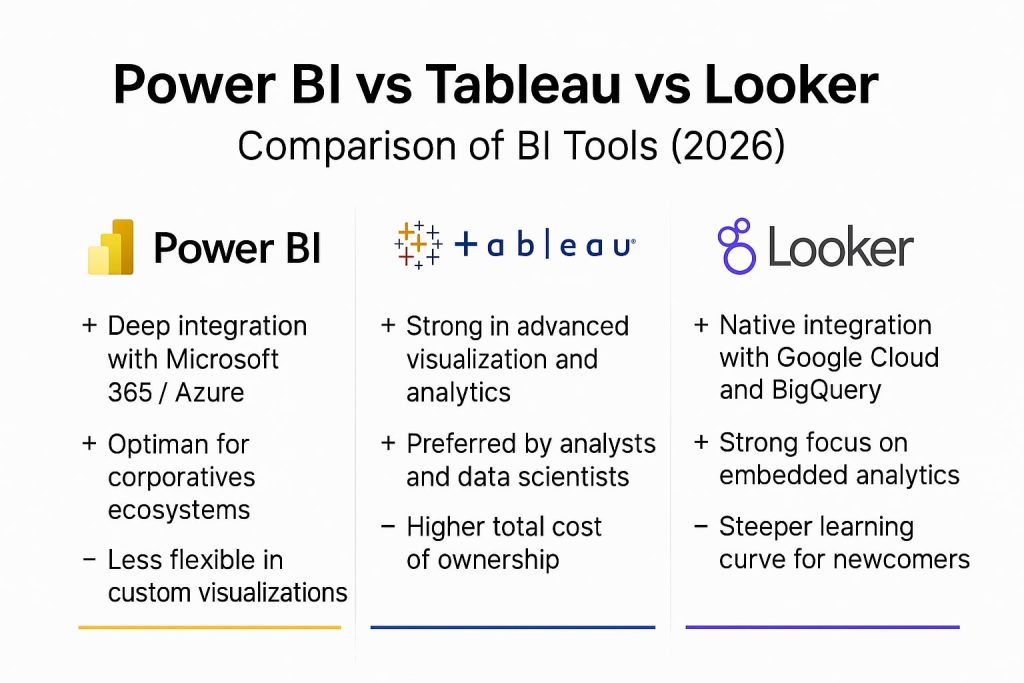
Power BI’s strongest advantage is its seamless integration with the Microsoft ecosystem. For companies already using Office 365, Azure, or Dynamics, adoption is almost frictionless. In 2026, the platform has gone beyond dashboards and offers AI Copilot features that allow users to interact with data using natural language. For example, managers can simply type: “Show me the top five underperforming regions last quarter and reasons for decline” — and Power BI generates an interactive report with predictive context.
Power BI also remains cost-effective, making it an attractive choice for startups and mid-market businesses. Yet, its scalability and governance capabilities make it equally appealing for large enterprises that must comply with strict security frameworks like HIPAA or GDPR. Its ability to deliver analytics inside tools people already use — Teams, Outlook, and Excel — ensures insights are embedded in daily workflows.
The tradeoff? Power BI’s visual capabilities, while improving, often lack the finesse of Tableau. For organizations where storytelling matters as much as accuracy, it may feel utilitarian rather than inspiring.
Tableau: Turning Data into Stories
Tableau is often called the gold standard in data visualization, and for good reason. While many tools generate dashboards, Tableau creates interactive stories that allow decision-makers to explore data visually, identify hidden patterns, and communicate insights in a compelling way.
Since Salesforce acquired Tableau, the platform has expanded into customer data analytics. Its Einstein Discovery AI enables predictive forecasting with no need for complex programming. Meanwhile, Tableau Prep simplifies the often painful process of cleaning and shaping data, helping analysts spend more time on insight generation.
Tableau is particularly strong in industries where presentation and persuasion matter: retail, marketing, and executive reporting. A retail CMO, for instance, can use Tableau to craft a visualization showing the direct relationship between campaign spend, customer engagement, and regional sales uplift.
However, Tableau’s pricing structure is higher than Power BI, and it requires more technical expertise to achieve full potential. For organizations prioritizing speed and affordability over visual finesse, it may feel excessive.
Looker: Cloud-Native Governance and Embedded Analytics
Looker has carved out its niche by addressing one of the most persistent BI challenges: data consistency. With Looker’s modeling language, LookML, enterprises define business metrics once and ensure they remain consistent across departments and geographies. This “single source of truth” is invaluable for fast-growing SaaS businesses, global supply chains, and financial organizations where discrepancies can cause costly errors.
Being part of Google Cloud, Looker leverages BigQuery and Vertex AI to provide cloud-native, AI-powered analytics. It’s particularly well-suited for organizations that want to embed BI into their own products. For example, a SaaS platform can use Looker to deliver analytics directly to customers as part of the product experience — not just for internal reporting.
The challenge is its learning curve. Looker is less intuitive for non-technical users compared to Tableau or Power BI. But for companies that value governance, scalability, and embedding capabilities, Looker is the tool of choice in 2026.
Multi-Tool Strategies: The Real Distinction
By 2026, the conversation around BI has shifted from “Which tool is better?” to “How do we orchestrate multiple tools to maximize business impact?”. Enterprises are no longer betting on a single platform; instead, they build hybrid BI ecosystems where each tool plays to its strengths.
In financial services, for instance, compliance and risk management require strict governance. Here, Power BI is used for auditable compliance dashboards integrated with Microsoft systems, while Looker ensures consistent fraud detection models across geographies. For strategic discussions with the board, Tableau produces visually compelling narratives that turn raw financial figures into clear business stories.
In retail, the stakes are speed and personalization. Tableau gives marketing leaders campaign performance dashboardsthat communicate the effectiveness of promotions in an engaging way. Looker powers customer-level personalization engines within e-commerce platforms, delivering tailored product recommendations. Meanwhile, Power BI supports operational reporting in logistics and supply chain — tracking inventory levels, delivery performance, and fulfillment costs.
In healthcare, where regulations like HIPAA dominate, Power BI ensures secure compliance reporting and patient data handling, while Looker enhances care quality with predictive models — for example, forecasting patient readmission risks or monitoring medication adherence. Tableau, on the other hand, helps administrators and policymakers communicate insights to diverse audiences with clarity and impact.
Every company has big data in its future, and every company will eventually be in the data business.
Thomas H. Davenport
The Future of BI in 2026 and Beyond
As we move deeper into 2026, BI is undergoing its most significant transformation since the introduction of dashboards. The next phase of evolution is not about more charts or prettier visualizations — it is about embedding intelligence into the fabric of business operations.
The first major force is AI-first BI. Generative AI and autonomous copilots are moving beyond assisting analysts with queries; they now anticipate business needs. Imagine a CFO logging into their BI tool to find not only quarterly reports already prepared, but also forecasts of cash flow risks and suggested actions to mitigate them. Or a logistics manager being alerted by the system — before a disruption occurs — that a shipment delay will affect delivery KPIs, along with suggested rerouting options. BI is no longer descriptive (what happened) but increasingly prescriptive and proactive(what will happen and what to do next).
The second force is embedded BI. Instead of existing as separate platforms requiring executives to log in and interpret, BI is becoming invisible — integrated directly into SaaS products, CRMs, ERP systems, and even workplace messaging tools. A sales rep inside a CRM no longer needs to request a dashboard; the analytics surface immediately, highlighting the probability of closing deals or recommending the next outreach action. This embedded nature ensures data insights flow seamlessly into daily decision-making, rather than sitting idle in siloed dashboards.
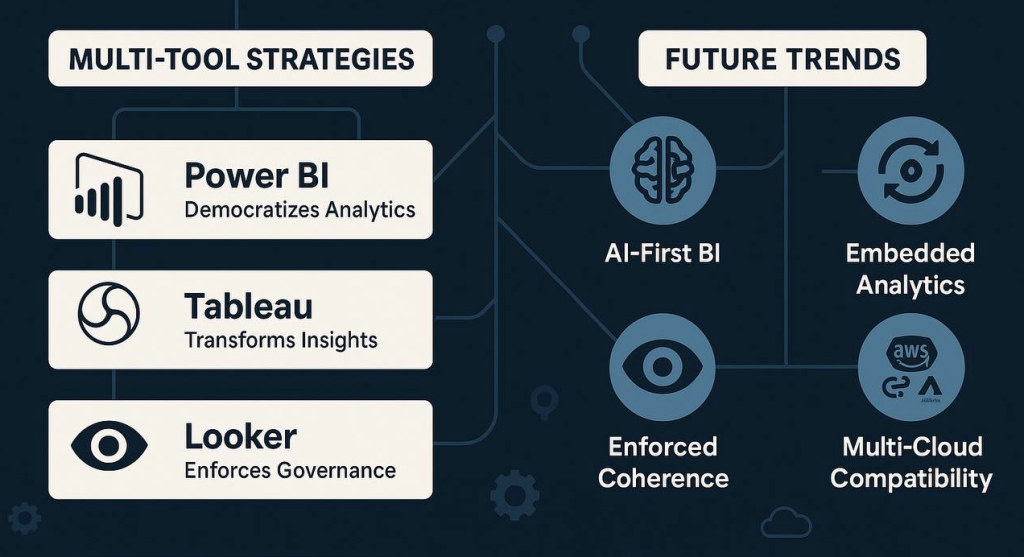
The third force is multi-cloud compatibility. With enterprises spreading their infrastructure across AWS, Azure, and Google Cloud, the future of BI lies in tools that can function across clouds without introducing data silos or governance risks. BI vendors are increasingly pressured to offer true interoperability, ensuring that whether data is in a GCP warehouse or Azure Data Lake, analytics remain fast, consistent, and secure. This is particularly critical for global organizations that must balance regional compliance laws with centralized intelligence.
Looking ahead, BI will not be viewed as an isolated reporting function. Instead, it will be seen as a strategic driver of competitiveness, powering faster pivots in volatile markets, improving customer experience personalization, and enabling predictive governance in regulated industries. In 2026 and beyond, the companies that thrive will be those that treat BI not as a tool but as a strategic nervous system for the entire digital enterprise.
Conclusion
In 2026, Business Intelligence (BI) is no longer a matter of choosing between Power BI, Tableau, or Looker — it’s about how organizations integrate and orchestrate them within their ecosystems. Each tool brings a distinct strength: Power BI democratizes data access, Tableau visualizes insights with unmatched clarity, and Looker governs data with precision and scalability.
The real advantage emerges when enterprises adopt a multi-tool strategy, aligning tools to specific needs instead of expecting one platform to do it all. Banks, retailers, and healthcare providers already illustrate this hybrid model, where BI becomes less of a reporting add-on and more of a strategic enabler of real-time decision-making.
As AI becomes embedded into analytics, BI tools will transition from describing “what happened” to prescribing “what to do next.” With embedded dashboards across CRMs, SaaS, and collaboration platforms, BI will become an invisible but vital backbone of every business workflow.
Why Ficus Technologies?
At Ficus Technologies, we understand that choosing the right BI tool is not about software — it’s about strategy.
Our BI consulting team helps clients:
- Assess their current ecosystem and select the tool mix that aligns with business goals.
- Implement secure, scalable architectures that comply with regulatory requirements.
- Embed analytics into SaaS products for customer-facing insights.
- Train teams to not just use BI tools but maximize adoption across the organization.
We don’t just install dashboards — we help companies turn data into growth.
Power BI is often the most cost-effective and user-friendly option, making it ideal for SMBs. It integrates well with Microsoft 365, lowering adoption barriers.
Tableau excels in advanced visual storytelling and interactive dashboards, while Power BI focuses on accessibility and ease of use. Both can deliver strong insights, but Tableau is preferred for highly visual, executive-level reporting.
Looker provides enterprise-grade governance, scalability, and embedded analytics. Its strength lies in centralized data models, ensuring accuracy and consistency across global teams.
Yes. In fact, hybrid BI strategies are becoming the norm in 2026. Companies mix tools to cover different needs — for example, using Power BI for compliance, Tableau for visualization, and Looker for data governance.