Business Intelligence (BI) has completed a quiet metamorphosis. What once served as a retrospective reporting function now operates as a strategic layer powering day-to-day decision-making and long-range planning. In 2025, BI is not an optional dashboard on top of the business; it is the operating system under it. As data volumes expand and data types diversify, organizations increasingly depend on BI to orchestrate how information is collected, modeled, governed, explained, and acted upon. The result is not just prettier reports or faster refreshes, but a more adaptive organization—one that can sense change, simulate options, and execute with confidence.
Enterprises that struggle with fragmented, noisy data typically encounter the same symptoms: competing versions of the truth, slow analytical cycles, and an inability to trace the lineage of a metric from source system to boardroom slide. Modern BI addresses these frictions by consolidating data across business domains, standardizing semantics, and embedding analytics into daily workflows. When this foundation is in place, leadership can move beyond hindsight and embrace foresight—anticipating market shifts, identifying operational inefficiencies, and designing interventions early enough to matter.
This article examines how Itransition helps organizations build BI ecosystems that scale technically and organizationally. The focus is not only on tools but also on architecture, governance, talent, and change management—because sustained value emerges when technology and operating model evolve in lockstep.
- BI systems help companies turn raw data into actionable business insights.
- Itransition’s approach focuses on scalability, customization, and integration across ecosystems.
- A strong BI solution drives data democratization, better forecasting, and strategic agility.
What is Business Intelligence?
Business Intelligence (BI) refers to a technology-driven process for collecting, integrating, analyzing, and visualizing business data to support informed decision-making. It encompasses tools, systems, and methodologies that turn raw data into meaningful insights — enabling companies to optimize operations, spot emerging trends, and align strategies with real-world performance indicators.
Business intelligence is no longer a ‘nice-to-have’ item. It is now a ‘must-have’ item to remain competitive.
Brett Stroh
What Business Intelligence Means in 2025
Today’s BI extends well beyond tabular reports and static visualizations. It encompasses data unification, near-real-time monitoring, predictive and prescriptive analytics, and the democratization of insights for non-technical users. The critical difference is that BI now governs the full journey of a decision: discovering signals in raw data, contextualizing them within shared metrics and definitions, surfacing them at the moment of need, and capturing feedback to improve subsequent decisions. This closed loop blurs the boundary between analytics and operations, enabling organizations to set targets, measure progress, and intervene dynamically rather than quarterly.
From a technology perspective, BI increasingly rides on cloud-native data platforms with elastic compute, automated orchestration, and fine-grained security controls. From a business perspective, BI increasingly relies on a canonical semantic layer that turns inconsistent data into consistent language—so that “churn,” “active user,” and “gross margin” mean the same thing in sales, finance, and product. When a BI program unites these technical and semantic layers, it becomes the backbone for strategic agility.
How Itransition Delivers End-to-End BI
Itransition approaches BI as an integrated capability rather than a bundle of projects. Engagements typically begin with strategy and governance design, move through architecture and implementation, and then shift into sustained optimization and enablement. The consulting phase aligns BI with business goals, regulatory needs, and the change adoption plan; the implementation phase constructs data pipelines, warehouses or lakehouses, and analytical models; the optimization phase tunes performance, automates reliability checks, and expands self-service; and the enablement phase invests in data literacy so stakeholders can use insights responsibly and consistently.
Technology choices are pragmatic and context-driven. For organizations standardizing on Microsoft, Power BI often anchors the visualization and semantic layers, with Azure services providing scalable ingestion, storage, and transformation. In environments where exploratory analytics and advanced visualization dominate, Tableau or Qlik may be preferred. Mixed estates are common; Itransition designs integration patterns that prevent tool proliferation from degrading the single source of truth. The guiding principle is fit-for-purpose adoption that balances feature depth, governance, cost, and the skills already present in the organization.
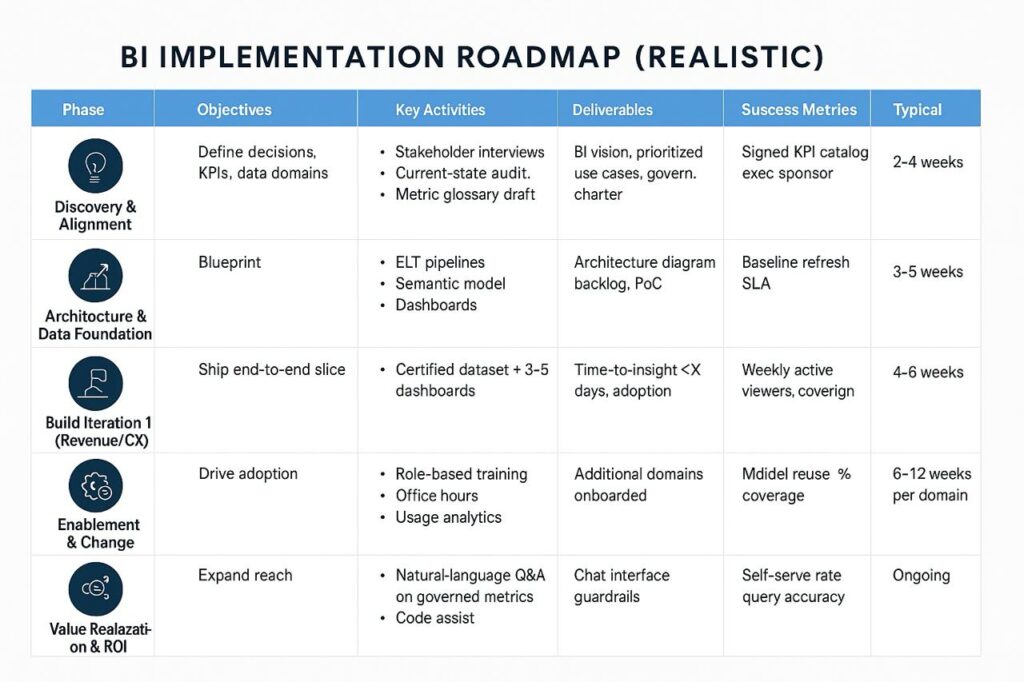
A Realistic Roadmap for BI Implementation
Effective BI programs rarely succeed through a single “big bang.” They progress through disciplined stages that each produce tangible value. Discovery clarifies core decisions, the KPIs that inform them, and the systems that generate relevant data. Architecture design translates those needs into a layered blueprint: sources and ingestion, raw and refined storage zones, transformation logic, a governed semantic layer, and consumption endpoints. Tool selection then becomes a consequence of architecture, not the other way around, reducing the risk of buying platforms that do not align with the data model or governance framework.
Execution proceeds in iterative waves. Early sprints focus on a handful of high-value use cases—often revenue, customer experience, or operational cost—with end-to-end pipelines and dashboards that establish patterns for data quality, lineage, security, and access management. Testing goes beyond visual checks: it validates metric definitions, performance at scale, and the resilience of refresh cycles. Training is not a one-off workshop; it is a program that equips different personas—executives, analysts, frontline managers—with workflows that match their responsibilities. As adoption grows, the roadmap expands to new domains, reusing the same architectural patterns and governance principles to maintain coherence.
The Data Foundation Behind BI
Under the BI surface sits the data foundation that makes timely, trustworthy insights possible. Ingestion and transformation pipelines (ETL/ELT) move data from operational systems, third-party sources, and event streams into a storage layer designed for both scale and flexibility. Many enterprises now favor lakehouse architectures that combine the openness of data lakes with the transactionality and schema discipline of data warehouses. Within this foundation, medallion-style layering (bronze, silver, gold) separates raw data from standardized, analytics-ready data and curated business entities, reducing coupling and improving reliability.
Data governance is the binding fabric. Clear ownership, data contracts, and automated quality checks prevent drift. Security policies enforce least-privilege access, while masking and tokenization protect sensitive fields. A well-curated semantic layer exposes metrics and dimensions in business terms and serves as the single point through which BI tools query the data. When augmented with ML and rules-based services, the BI stack can also enrich datasets with predictions, scores, and segmentations that are easy to interpret and operationalize.
Industry Applications with Measurable Outcomes
BI’s value becomes obvious when viewed through industry-specific lenses. In retail, the combination of unified product, inventory, and behavioral data supports dynamic pricing, tailored promotions, and precise demand forecasts; small percentage lifts in conversion yield outsized revenue impact at scale. In automotive, cloud-based analytics shorten the feedback loop between engineering, manufacturing, and market performance, enabling earlier identification of quality issues and faster iteration on features customers actually use. In finance, governed BI platforms underpin risk scoring, anti-fraud monitoring, and regulatory reporting, where auditability and lineage are as important as speed. In healthcare, analytics improve scheduling, capacity planning, and patient outcomes by aligning resource allocation with predicted demand. Logistics and telecom use BI to balance network loads, optimize routing, and monitor SLAs in near real time.
Itransition’s programs frequently translate into quantifiable improvements. It is not uncommon to see order-of-magnitude acceleration in data processing when legacy, on-prem pipelines move to a modern, elastic stack; the shift can reduce infrastructure costs by half when idle resources are eliminated and storage tiers are optimized. Delivery timelines compress when teams adopt reusable patterns, shared semantic models, and automated testing; power-users become more productive once the learning curve is addressed through tailored enablement.
The BI Operating Model—From Project to Product
Many BI efforts stall not because of technology, but because of how they are run. Treating BI as a standing product rather than a series of projects changes the trajectory. A BI Center of Excellence (CoE) defines standards for modeling, visualization, and governance; curates the semantic layer; certifies key datasets; and partners with domain teams to iterate on use cases. Federated data product ownership assigns clear accountability for data quality and metric definitions to the teams closest to the source. Funding shifts from sporadic capital projects to durable product budgets that support continuous improvement. The outcome is a BI capability that evolves alongside the business rather than decaying between initiatives.
Ready to turn your data into a competitive advantage?
Contact UsProof Points and Client Perspectives
Programs executed along these lines routinely generate material improvements. Data processing times can improve by a factor of ten when legacy bottlenecks are engineered out of the pipeline and workloads are right-sized to demand. Infrastructure expenses drop when storage and compute align to workload patterns, with many organizations reporting reductions of roughly half compared to static, over-provisioned estates. Project delivery accelerates when teams adopt shared semantic models and systematic enablement; it is common to see development cycles cut in half after establishing consistent patterns and training power users. Clients frequently highlight not only the technical proficiency but also the ability to engage deeply with business context, quoting Itransition’s responsiveness on mission-critical projects and its knack for resolving complex issues without disrupting operations.
Conclusion
BI has matured into a strategic discipline that fuses data engineering, analytics, governance, and organizational change. The payoff is a business that can learn continuously: sensing what is happening now, anticipating what will happen next, and coordinating responses across functions. Itransition’s approach emphasizes durable architecture, a product-centric operating model, and responsible augmentation with GenAI—elements that together deliver both speed and trust. For organizations navigating volatile markets, BI is the mechanism that turns complexity into clarity and information into advantage.
Why Ficus Technologies?
We build BI ecosystems that scale—technically and organizationally—and we sign up for outcomes, not just dashboards.
How we deliver:
- Strategy → delivery → enablement: Decision mapping, governance design, and cost model; then pipelines, models, and semantic layer; then training and adoption.
- Lakehouse without the drama: Open formats, ACID tables, medallion layers, lineage as code, rigorous data-quality SLAs.
- Semantic layer first: Certified metrics with clear ownership; one query surface for multiple tools (Power BI, Tableau, Qlik).
- Embedded & reverse ETL: Insights where work happens; alerts and write-back to close the loop.
- Security & compliance: Least privilege, masking/tokenization, audit trails; experience in regulated domains (finance, healthcare).
- Cost transparency: Workload right-sizing, storage tiering, unit-economics dashboards for the platform itself.
Business Intelligence refers to a suite of technologies, processes, and tools that collect, analyze, and visualize data to support informed, strategic decision-making.
BI enables organizations to uncover hidden patterns, forecast trends, optimize operations, and enhance overall efficiency — leading to better business outcomes and competitive advantage.
BI drives value across finance, retail, healthcare, manufacturing, logistics, and other sectors where data-driven insights are crucial for operational success.
Yes. Itransition’s BI solutions are designed to integrate with ERP, CRM, databases, cloud platforms, and other enterprise systems without disrupting existing workflows.