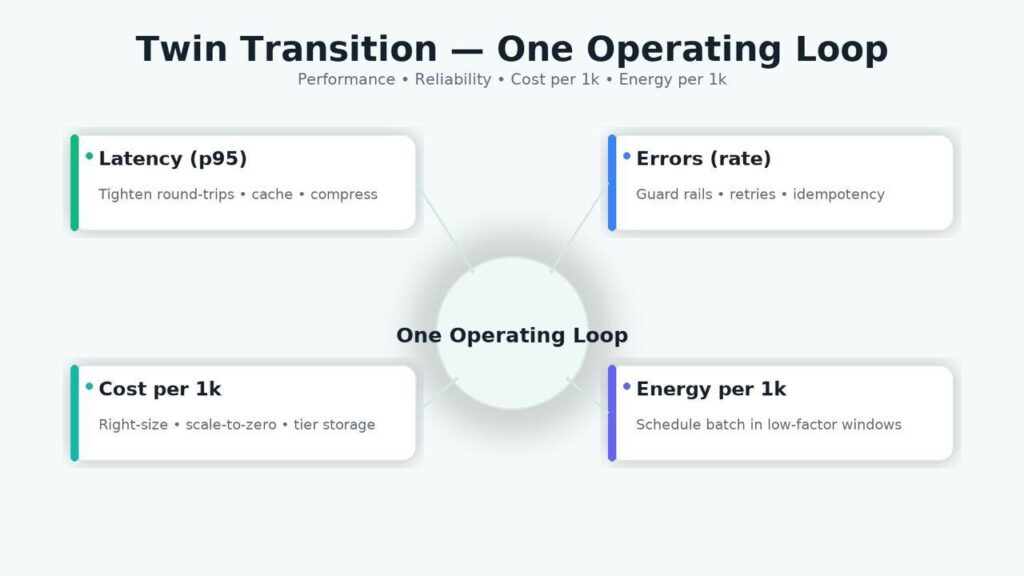
The “Twin Transition” links digitalization and sustainability into one operating system for technology teams. In practice, that means running the same loop for latency, errors, cost per 1k requests, and energy per 1k requests—and pushing architectural changes that improve all four. When you treat sustainability as a systems constraint (not a standalone report), you eliminate wasteful work, place compute where it’s most efficient, and make your stack both faster and leaner.
Twin transition is not new tooling; it’s disciplined engineering: event-driven integration instead of chatty APIs, storage tiering with hard TTLs, ML that is distilled/quantized for “accuracy per joule,” and batch/training jobs scheduled by price/energy windows without breaching SLOs.
- Treat performance, cost, and energy as one system; show them on the same SLO dashboard.
- Shift integrations to events/streams; remove polling and redundant round-trips.
- Enforce TTL/tiering and right-size/scale-to-zero; stop paying for idle.
What Is “Twin Transition” in IT?
Twin Transition is the practice of running digitalization (cloud/edge, data platforms, automation, AI) and sustainability (lower energy, less waste, resilient operations) as one engineering system, not two parallel initiatives. In concrete terms, the same loop that governs app performance also governs resource use: teams track latency and errors alongside cost-per-1k requests and energy-per-1k requests, and ship only those changes that improve (or at least hold) all four.
Unlike ESG reporting, Twin Transition lives in the runtime:
- Integration shifts from chatty, polling APIs to event/stream patterns to cut round-trips, tail latency, and bandwidth.
- Compute placement distinguishes online vs. nearline vs. batch; online stays close to users, while batch/training is scheduled in low-price/low-energy windows with checkpoints and retries.
- Data lifecycle enforces TTL and tiering (hot → warm → cold) so cold data doesn’t sit on hot storage; CDNs and compression reduce payloads.
- AI efficiency optimizes for accuracy per joule: retrieval over unnecessary retrains, distilled/quantized models, KV-cache and batching, and model routing (small-fast by default, large only on triggers).
- Observability creates audit-ready traces per decision (inputs, retrieved context, tool/model calls, latency, cost, energy estimate, outcome), turning “green claims” into verifiable evidence.
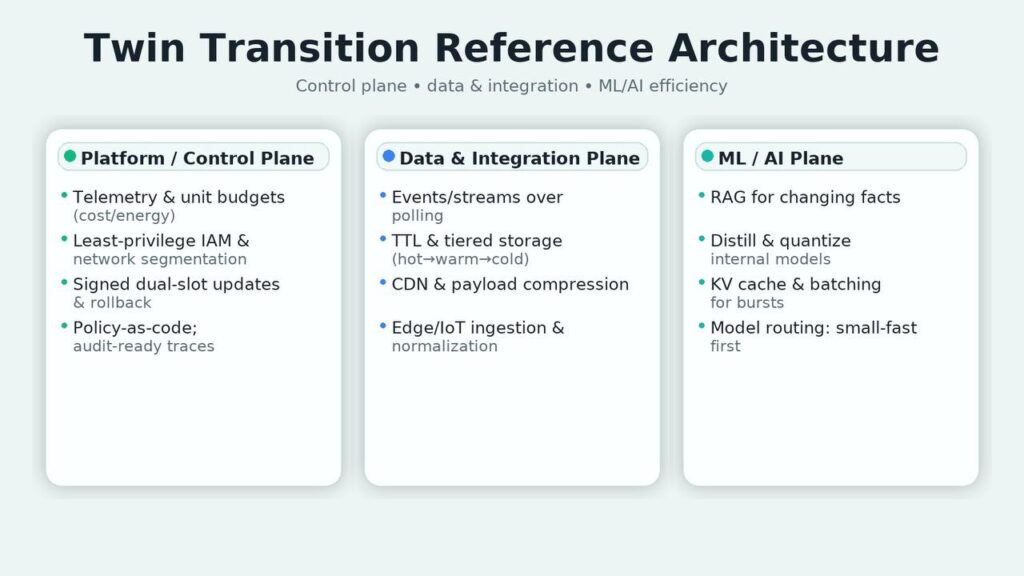
What it’s not: a marketing layer or carbon spreadsheet bolted on after the fact. What it is: platform discipline—policies as code, per-service budgets for cost/energy, least-privilege IAM, network segmentation by default, signed dual-slot rollouts, and routine “idle asset” cleanup.
Where it fits: in the platform/control plane (telemetry, budgets, placement rules), the data plane (events, storage classes), and the ML/AI plane (routing and guardrails). The outcome is a stack that’s faster and cheaper to run—and, as a property of that efficiency, uses fewer resources.
Operating model
Ownership is end-to-end. Domain teams own product logic and their data sets; the platform sets standards for telemetry, network segmentation, secrets, and upgrades; FinOps/GreenOps formalize cost and energy budgets as first-class SLOs alongside latency. Weekly working sessions remove “empty” operations (excess calls, duplicate compute, idle resources). Monthly QBRs capture deltas on the four metrics and agree the next efficiency bets.
Data & telemetry backbone
Before optimization, make the system visible. Establish a minimal, consistent schema: performance events (route, volume, p95, errors), true infrastructure cost (CPU/GPU hours, storage, egress), and energy profile (direct meter, provider factor, or PUE-adjusted). Feed all sources into one catalog and one dashboard where each service is expressed through p95/errors, cost per unit, and energy per unit. This view kills cosmetic “green” initiatives and exposes real bottlenecks.
Event-centric integration. Integrations revolve around events. IoT/edge emit node and equipment telemetry; business events capture orders, replenishment, and shipments; ops events reflect deployments and config changes. Events are first-class because they link outcome and resource footprint for the same process. Where polling and chatty APIs existed, switch to streams and batch windows: fewer round-trips mean lower tail latency and lower kWh.
Compute & storage strategy
Online workloads stay in low-latency zones with right-sizing, caching, compression, and connection pooling. Near-real-time and batch move to windows/regions with better price/energy profiles; all jobs support checkpoints and retries. Storage is disciplined with TTL and tiering: hot sets sit close to compute, warm on cheaper classes, cold in archive with indexes for selective restore. This eliminates pointless reads and scans that silently burn money and power.
AI/ML layer
Models are a means, not a goal. When facts change, prefer retrieval-based approaches over constant retrains. In production, target accuracy per joule: distill and quantize internal models, route requests between fast and costly variants, enable KV cache and batching for bursts. AI services live under shared constraints: token and budget limits, source requirements, PII redaction, strict tenant boundaries. That keeps quality, spend, and auditability under control.
Observability & evidence
Every decision should be traceable: which inputs were used, what context was retrieved, which tools were invoked, latency, cost, estimated energy, and outcome. Config and admin changes land in immutable logs. This “evidence base” isn’t just for auditors; it makes regressions reversible and incident analysis fast because teams share one source of truth and reproducible traces.
Security, privacy, change management
Least-privilege IAM, default network segmentation, secrets from a vault, and dual-slot (A/B) updates with automatic rollback on failed health checks. For edge/perimeter, require signed bundles and a remote kill-switch; for services, externalize access policies so rules change without redeploys. Label sensitive data at source; govern movement by explicit purpose and log it.
90-day rollout
Month 1 — Instrument & baseline. Tag resources; export cost and energy; build the per-unit dashboard; pick three online services and one heavy batch job for a pilot.
Month 2 — Safe engineering cuts. Right-size and autoscale; enable scale-to-zero in non-prod; turn on compression and pooling; enforce TTL/tiering; offload static to CDN. For ML endpoints: enable batching + KV cache; quantize at least one internal model.
Month 3 — Placement & proof. Schedule batch/analytics by price/energy under deadlines; add performance profiling to CI to block CPU/memory regressions; run recurring idle-asset cleanup. Publish a short report on p95/errors and the delta in cost/1k and kWh/1k; if stable, templatize and roll to the next set of services.
Eager to align your IT with 2025’s digital and sustainability goals?
Contact UsRisks and controls
- Rebound effect. Efficiency can raise appetite—enforce hard per-service budgets and alert on trend slope, not only thresholds.
- Paper sustainability. Reports that don’t reconcile with traces are invalid; tie claims to the shared dashboard.
- Hardware/runtime sprawl. Limit to one–two target profiles per form factor; keep builds reproducible.
- Data/model drift. Maintain a small but continuous sampling and labeling stream so metrics don’t become guesses.
Build vs buy
Buy fleet/device management, billing telemetry, connectors, and parts of the data catalog. Build domain features and models, retrieval/optimization layers, decision policies, and update pipelines. Avoid lock-in: standard model formats and versioned configs; provider-agnostic tracing.
Conclusion
Twin Transition works when performance, cost, and resource load are managed as one system. Remove unnecessary work, place compute intelligently, and keep cost and energy per unit next to p95 and errors. Sustainability then shows up not as decoration but as a property of well-designed systems—and the business wins twice.
Start with provider factors or PUE-adjusted estimates tied to your workload telemetry. Precision can improve later; what matters is consistent per-unit tracking aligned with p95 and error rate.
Kill zombie resources, enable compression and connection pooling, add cache layers for hot reads, and move static/media to CDN. Pair with TTL/tiering so cold data stops living on hot storage.
Use RAG to avoid unnecessary retrains, and compress internal models (distill/quantize). Add KV-cache and batching. Route small/fast models for 80% of traffic; escalate to larger models only on score/constraint triggers.
Make claims reconcilable with traces: each decision carries inputs, context, latency, cost, and energy estimate. If it isn’t in the trace store, it doesn’t count.
